How to design a simple infographic for your business and promote it online
Infographics can be a great addition to your content marketing mix. They are attention grabbing, highly shareable and tend to have a long shelf life.
Derived from the terms “information graphics”, infographics contain valuable information in a visually appealing format. They can be easier to scan and digest for users – helping to get your message across better than straight text.
If creating an infographic has been lingering on your marketing to-do list but you thought it was too hard to accomplish, well think again. These days you can create a very effective and professional looking infographic to get your message seen without spending a lot of time and money (a goal for many small businesses).
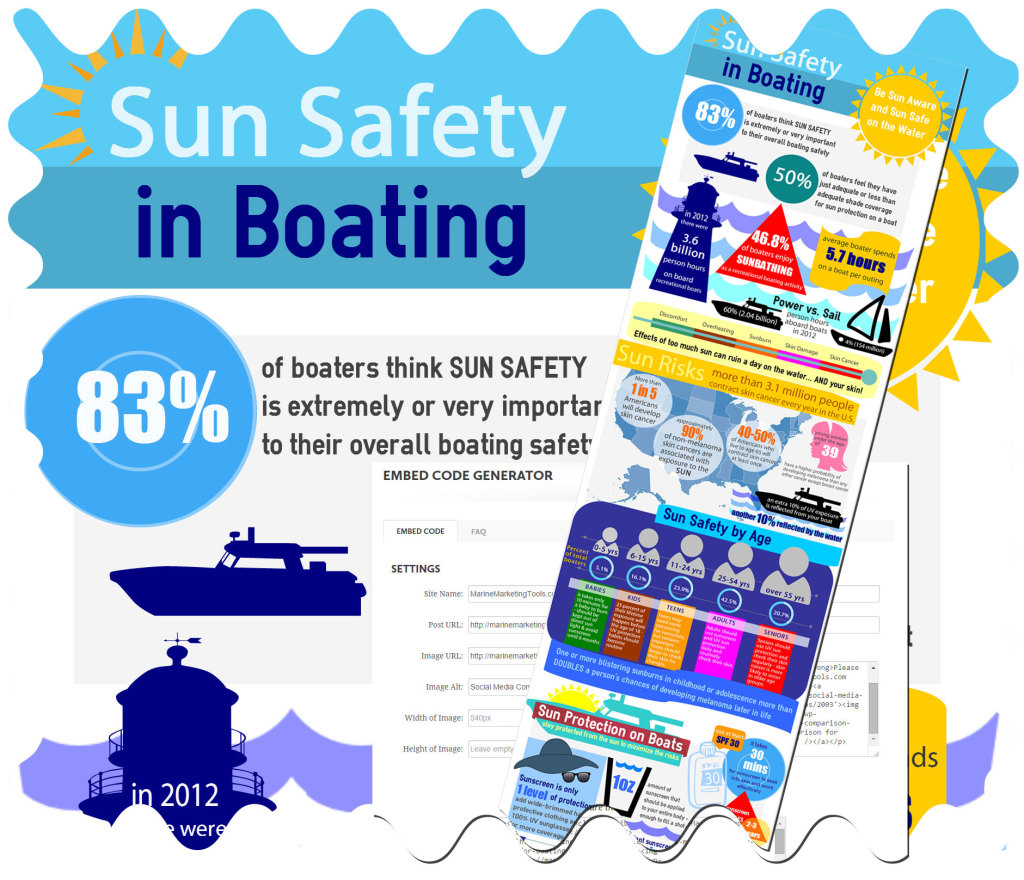
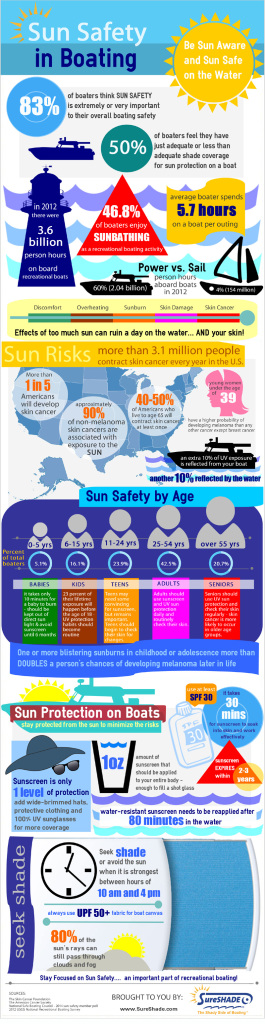
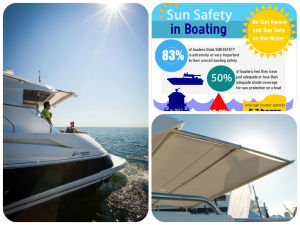
Here are the infographic tools I used recently to create the very popular infographic called Sun Safety in Boating for SureShade (a company that makes retractable boat shades… and I also happen to work as their marketing director).
Step 1: Information Gathering
Before you start building an infographic you want to get all your facts together (you know, the information!)
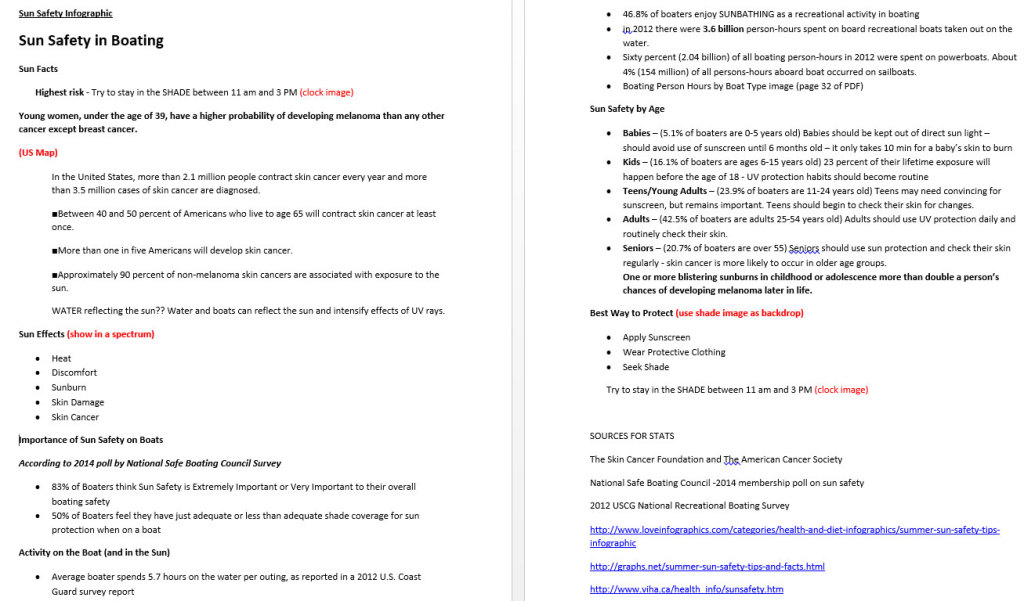
I put together an outline of how I wanted the infographic to flow (main sections I wanted to highlight) and then did a bunch of online research to find statistics and facts to support each section. I also made notes where I envisioned certain visuals to be within the flow of the infographic. And of course I made note of all the sources I used in my research so I could be sure to include them at the end for the list of sources.
In one case there was a statistic I wanted to use that I didn’t have, so we reached out National Safe Boating Council and asked them to help us with a membership survey on the importance of sun protection for safer boating (SureShade is a member of NSBC they were happy to help out – plus we promised to give them credit in the infographic).
Once I had all the information that I wanted to feature it was time to transform it into graphics and make it come to life!
Step 2: Create the Infographic
Yes this is a big step…. but it was easier than I initially thought. I was lucky to find a great user-friendly tool that helped me create a graphic that I could be proud to use. As a bonus the tool was free to use – making it even better!
I chose to use Easil.ly because it was free, easy to use and offered lots of customization options. It takes a little bit of practice, but super easy once you get the hang of how to select options, drag and drop, resize, change colors, etc.

 You start off by selecting a basic template, but you can change just about anything you want. Some of the pre-populated graphics in the template layouts are useful to give you ideas on how to lay things out. Anything you don’t want to use in the template can be either altered (size, color) or deleted.
What I really love about Easil.ly is that you can upload your own images, logos or icons to supplement the graphics they already provide you. So whenever I was unable to find just the right graphic to use, I did a search for free icons and graphics online that I could upload and add to my infographic.
Once you are done you can download the infographic as a .jpg image (high or low quality) or a PDF. I saved as a high quality .jpg.
My only issue was creating a bigger infographic than the template would in length. So I created my infographic in 3 pieces and then joined them together in PhotoShop as 1 large infographic image.
Step 3: Sharing Your Infographic Online
Once the infographic is complete it is best to write a blog post or other content that can accompany the infographic. This is where you introduce the content, explain what it is about and actually embed it into your post for viewing… making the image as large as possible on your page. It also helps if you make the image clickable to open in a new browser in case someone wants to zoom in on it.
It helps if you include INFOGRAPHIC in the title of the post to give it visibility that your post includes a valuable infographic.
Your blog post or website page is “home base” for all promotions you want to do for your infographic. You want to drive traffic back to this page to see the full infographic as well as grab the embed code to share (see next step).
Step 4: Creating Embed Code to Share on Blogs or Websites
On blog pages under infographics you often see a box that contain HTML code for bloggers and other websites to use the infographic on their own site. If you included your logo within the infographic you’ll be happy to share – and hopefully get traffic back to your site!
I found a great free tool developed by Siege Media called a Embed Code Generator (you’ll want to bookmark this page as a great web resource… and I also recommend checking out their awesome content).
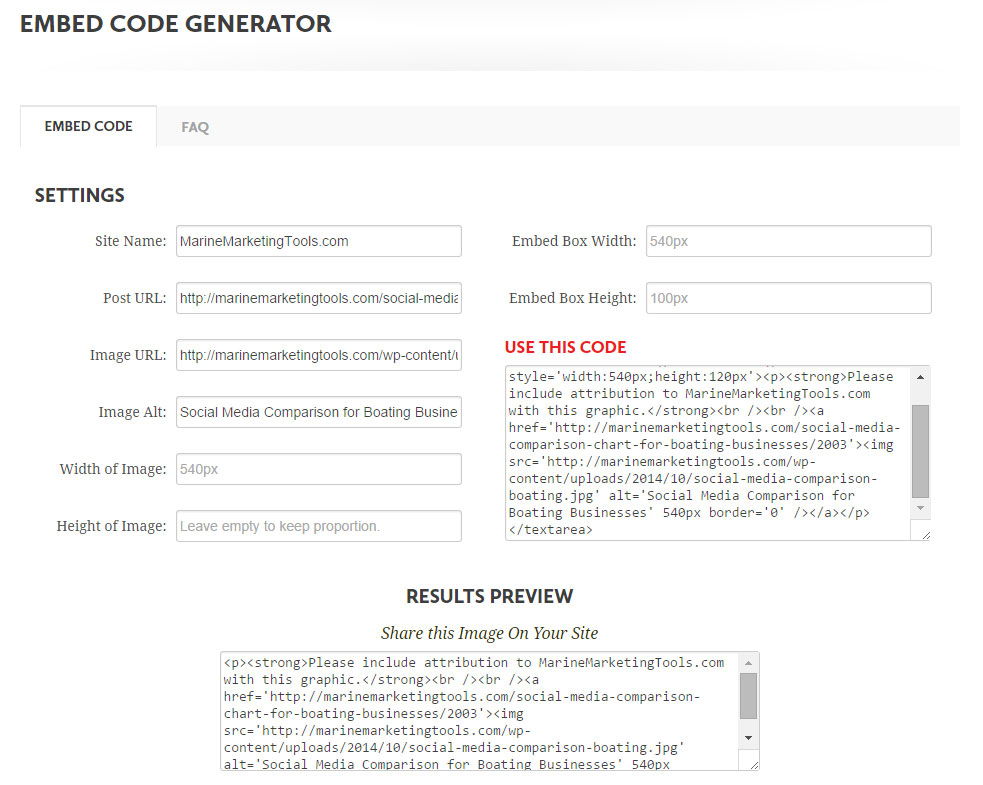
The tool is fairly self-explanatory – just fill in the details of your post URL (that contains the infographic), the URL of the infographic image, your website and out pops code that you can plug into your blog.
It is also a great tool for anything that you want to share on your blog – for example, I used it recently for a social media comparison chart I created on MarineMarketingTools.com (a collaborative marine marketing site I run for the boating industry).
If you need more help, you can reference this great post by HubSpot.com that details step-by-step how to use the embed code generator.
Step 5: Sharing and Promoting on Social Media
After we created our infographic is was an all-out content marketing blitz. We plugged it on every social media outlet where we had an account and of course we included it as a feature in our customer newsletter (actually throughout the summer because it was timely for the season). We also issued an announcement to our industry trade publications and had some great luck getting picked up by trade publications, partners and customers.
The biggest issue we had was promoting it on Facebook. When we chose to boost the post with a piece of the infographic image (and you pretty much HAVE to boost a post on Facebook to be seen) it was not approved because of Facebook’s 20% rule: photos must not have more than 20% text in them.
The 20% text rule is very much a problem when promoting infographics on Facebook – and apparently a known issue for “experts” that create infographics. This is no doubt why you don’t see as many infographics promoted on Facebook as you would expect to see.
To get around the issue, I created another image that represented the infographic but was less text so it would be approved for a boost.
We have had our best luck on Pinterest. Infographics stand out really well on Pinterest because of their vertical nature (just as long photos do well on Pinterest). We also created a Sun Safety in Boating board and have seen many repins, likes and follows for the infographic. Because of the longevity of the subject we expect it to continue to be popular.
So what are you waiting for? With so many free and easy tools available to use, any small business can now create a compelling infographic to ramp up their content marketing efforts.


Thanks for sharing such a great post, got to it via bizsugar! really liked it! I was thinking about trying infographics the other day!