 How do your business expenses compare to the national average… and are you tracking them right? See how businesses spend and track by category in Infographic study
Knowing how you spend your money each month is the first step in managing a budget for your business. Do you know how your money is allocated across each expense category? And more importantly, are you tracking your expenses well enough to be able to categorize expenses and cut back where you may be overspending?
See how your small business expenses compare to the national average with this Infographic put together by Shoeboxed.com, a service that allows small businesses to track their expenses.
They aggregated expense data from over 12,000 customers to put together the results of this Infographic study. The categories represent the most common small business tax deduction categories for the United States… so you can use this Infographic to compare how your business stacks up with the national average.
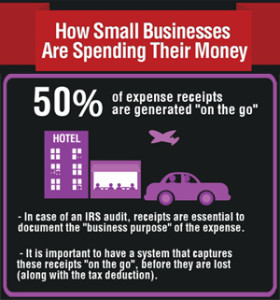
How Small Businesses are Spending Money

Small Business Expenses Infographic – Courtesy of Shoeboxed.com
The fact that 50% of business expenses are generated “on the go” is actually not that surprising in today’s mobile world. So capturing these receipts before they are “lost expenses” is really important.